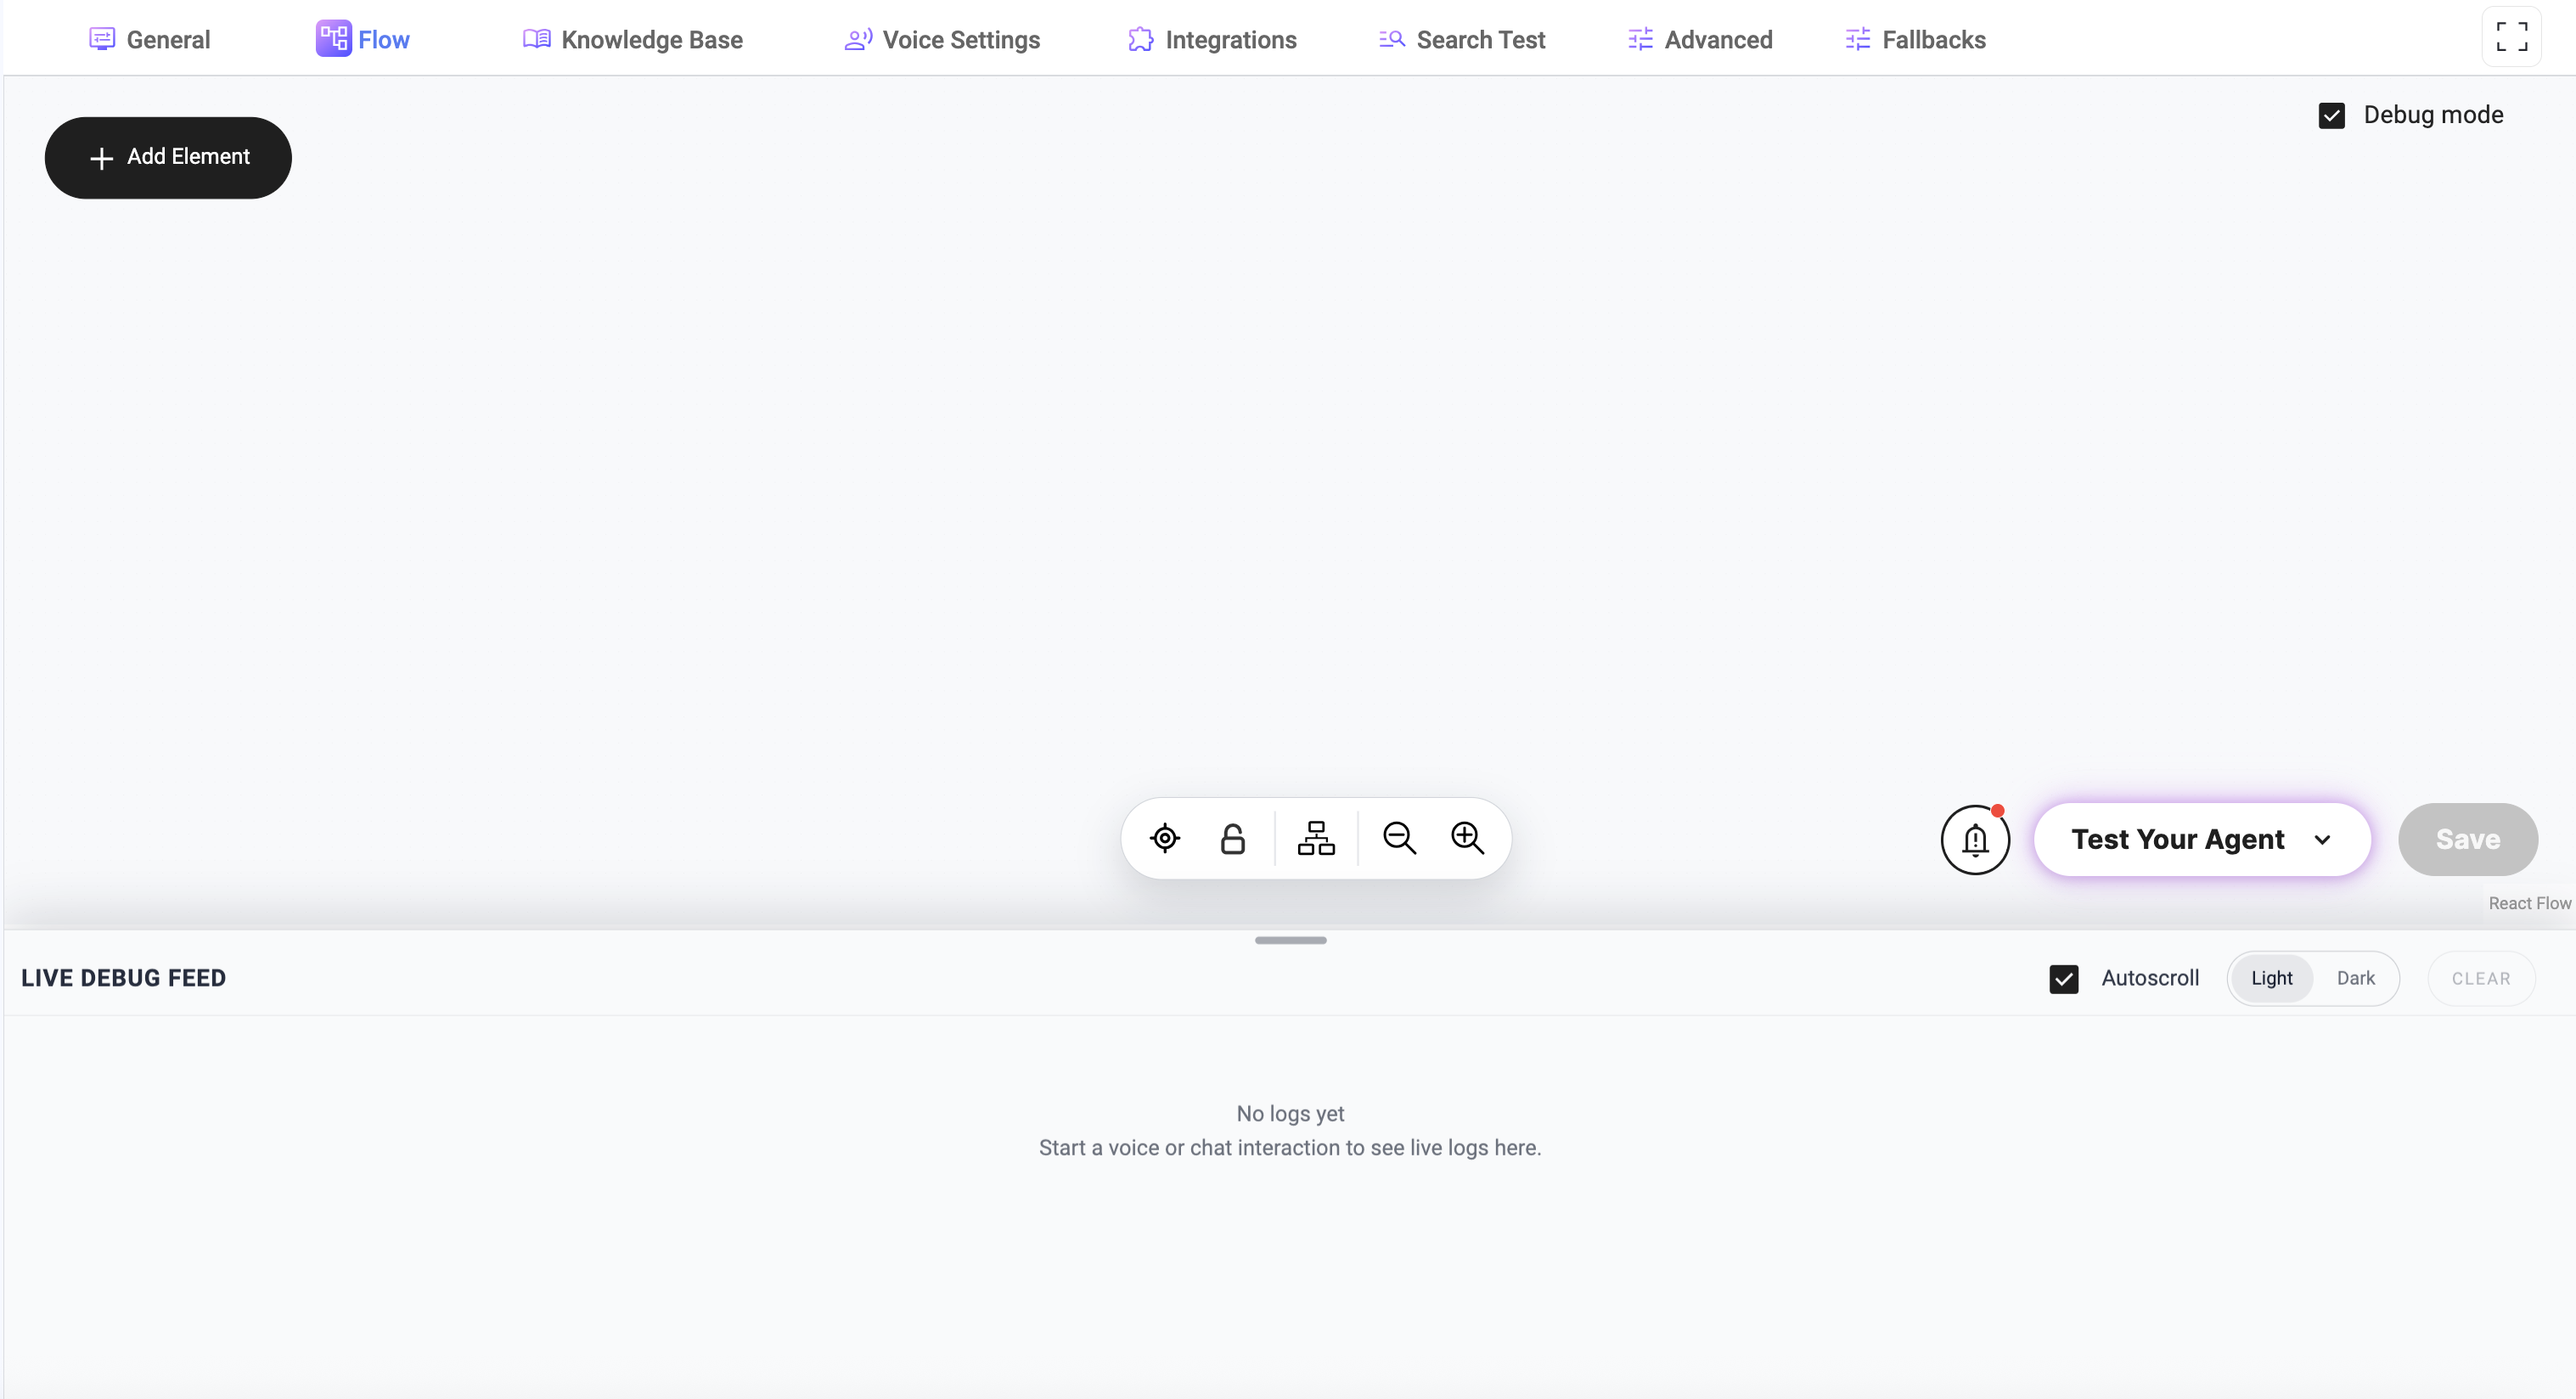
Debug Mode allows developers and operators to monitor the internal bot execution process in real time directly from the platform interface.
While the assistant processes user requests, logs are streamed into the Live Debug Feed, showing step-by-step execution details including tool calls, actions, execution time, responses, warnings, and errors.
Enabling Debug Mode
Debug Mode can be enabled directly from the bot Flow editor.
Navigate to:
Enable the Debug mode checkbox in the top-right corner of the Flow editor interface.
Debug logs will start appearing in the Live Debug Feed only after Debug Mode is enabled.
What is Debug Mode
Debug Mode is a real-time debugging interface that helps monitor:
- Active flows
- Tool execution
- Action execution
- LLM requests and responses
- Errors and warnings
- Custom logs from Function actions
- Execution timing and performance
Logs are streamed directly from the backend and displayed live without refreshing the page.
Why Use Debug Mode
| Scenario | What Debug Mode Provides |
|---|
| Bot gives unexpected response | Shows active flows, tools, and passed arguments |
| Action works slowly | Shows execution time for every action |
| Need to inspect action result | Shows full JSON result returned by actions |
| LLM behaves unexpectedly | Shows model name, API version, and full response |
| Tool or action error | Shows [ERROR] and [WARNING] messages |
| Developing custom Function actions | Shows custom logs created through interaction["_LOGGING"] |
Live Debug Feed
The Live Debug Feed displays all interaction logs in chronological order.
Each log entry contains:
| Field | Description |
|---|
| Timestamp | Time in HH:MM:SS.mmm format |
| Level | [INFO], [WARNING], [ERROR], [DEBUG] |
| Event Type | [CHAT], Action, Tool, or system event |
| Message | Short description of the event |
Session Start Example
16:37:02.024  [INFO]  [CHAT]  Session started
16:37:02.029  [INFO]          Active flow: "Root Flow"
User Request Example
16:37:12.196  [INFO]  [CHAT]  Request  "propan"
                              Tools (1): "commodity_code_search"
16:37:13.589  [INFO]  [CHAT]  Tool  Running tool "commodity_code_search"
                              Arguments: product_name: Liquefied propane...
                              Tool description: Use this tool to search for...
- Tool name
- Arguments passed by the LLM
- Tool description
- Tool execution start
Action Execution Example
16:37:13.946  [INFO]  Action  Action "reasoning_rag"
                              Condition: "PASS"
                              Execution time: 14.106 sec
                              Result: {"answers": [...], "found_digit_code": null}
| Field | Description |
|---|
| Condition | Whether execution condition passed (PASS or SKIP) |
| Execution time | Time spent executing the action |
| Result | Full JSON response returned by the action |
16:37:28.294 [INFO] Tool execution finish: 14.705 sec
Bot Response Example
16:37:29.183  [INFO]  [CHAT]  Response  "Which best describes..." in 16.982 sec
                              API version: Responses
                              Model name: Openai "gpt-5.2 Chat"
- Final assistant response
- Total generation time
- API provider version
- Model name
Custom Logs in Function Actions
Function actions can send custom logs directly into Debug Mode using interaction["_LOGGING"].
Example
def my_function(tool_params, interaction):
    interaction["_LOGGING"].info("Starting product lookup")
    interaction["_LOGGING"].warning("Product not found, using fallback")
    interaction["_LOGGING"].error("External API returned 500")
    interaction["_LOGGING"].debug("Raw response: " + str(raw))
Logging Levels
| Level | Description |
|---|
| INFO | Standard execution information |
| WARNING | Non-critical issue or fallback |
| ERROR | Critical execution problem |
| DEBUG | Detailed developer debugging information |
Full Debug Flow Example
16:37:02.024  [INFO]  [CHAT]  Session started
16:37:02.029  [INFO]          Active flow: "Root Flow"

16:37:12.196  [INFO]  [CHAT]  Request  "propan"
                              Tools (1): "commodity_code_search"

16:37:13.589  [INFO]  [CHAT]  Tool  Running tool "commodity_code_search"

16:37:13.946  [INFO]  Action  Action "reasoning_rag"
                              Condition: "PASS"
                              Execution time: 14.106 sec

16:37:28.294  [INFO]          Tool execution finish: 14.705 sec

16:37:29.183  [INFO]  [CHAT]  Response  "Which best describes your propane shipment?"
                              Model name: Openai "gpt-5.2 Chat"
Technical Details
- Logs are streamed through Redis pub/sub.
- Events are stored in
events:{interaction_uuid} queue with TTL.
- Each log contains:
idtimestamplevelmessage- optional
details
- optional nested
children
- Nested logs are displayed in UI as expandable trees.
- Logs remain available during TTL lifetime after interaction completion.
Notes
- Debug Mode is intended for development and troubleshooting.
- Full responses and action results may contain sensitive information.
- Excessive debug logging may affect readability during large interactions.
- Custom Function logs are supported only inside Function-type actions.